
Supplements for the paper
Human Biology Vol. No. pp.
Selection on the Human Bitter Taste Gene TAS2R16 in Eurasian Populations
Supplement Table.
The long range haplotypes defined by all the 55 SNPs
Color figures:

Figure 1. Spacing and molecular positions
of the markers typed.
The rs numbers can be used to retrieve the allele
frequencies in ALFRED (http://alfred.med.yale.edu/). Gaps in the numbering and
associated positions indicate the borders of the genes.
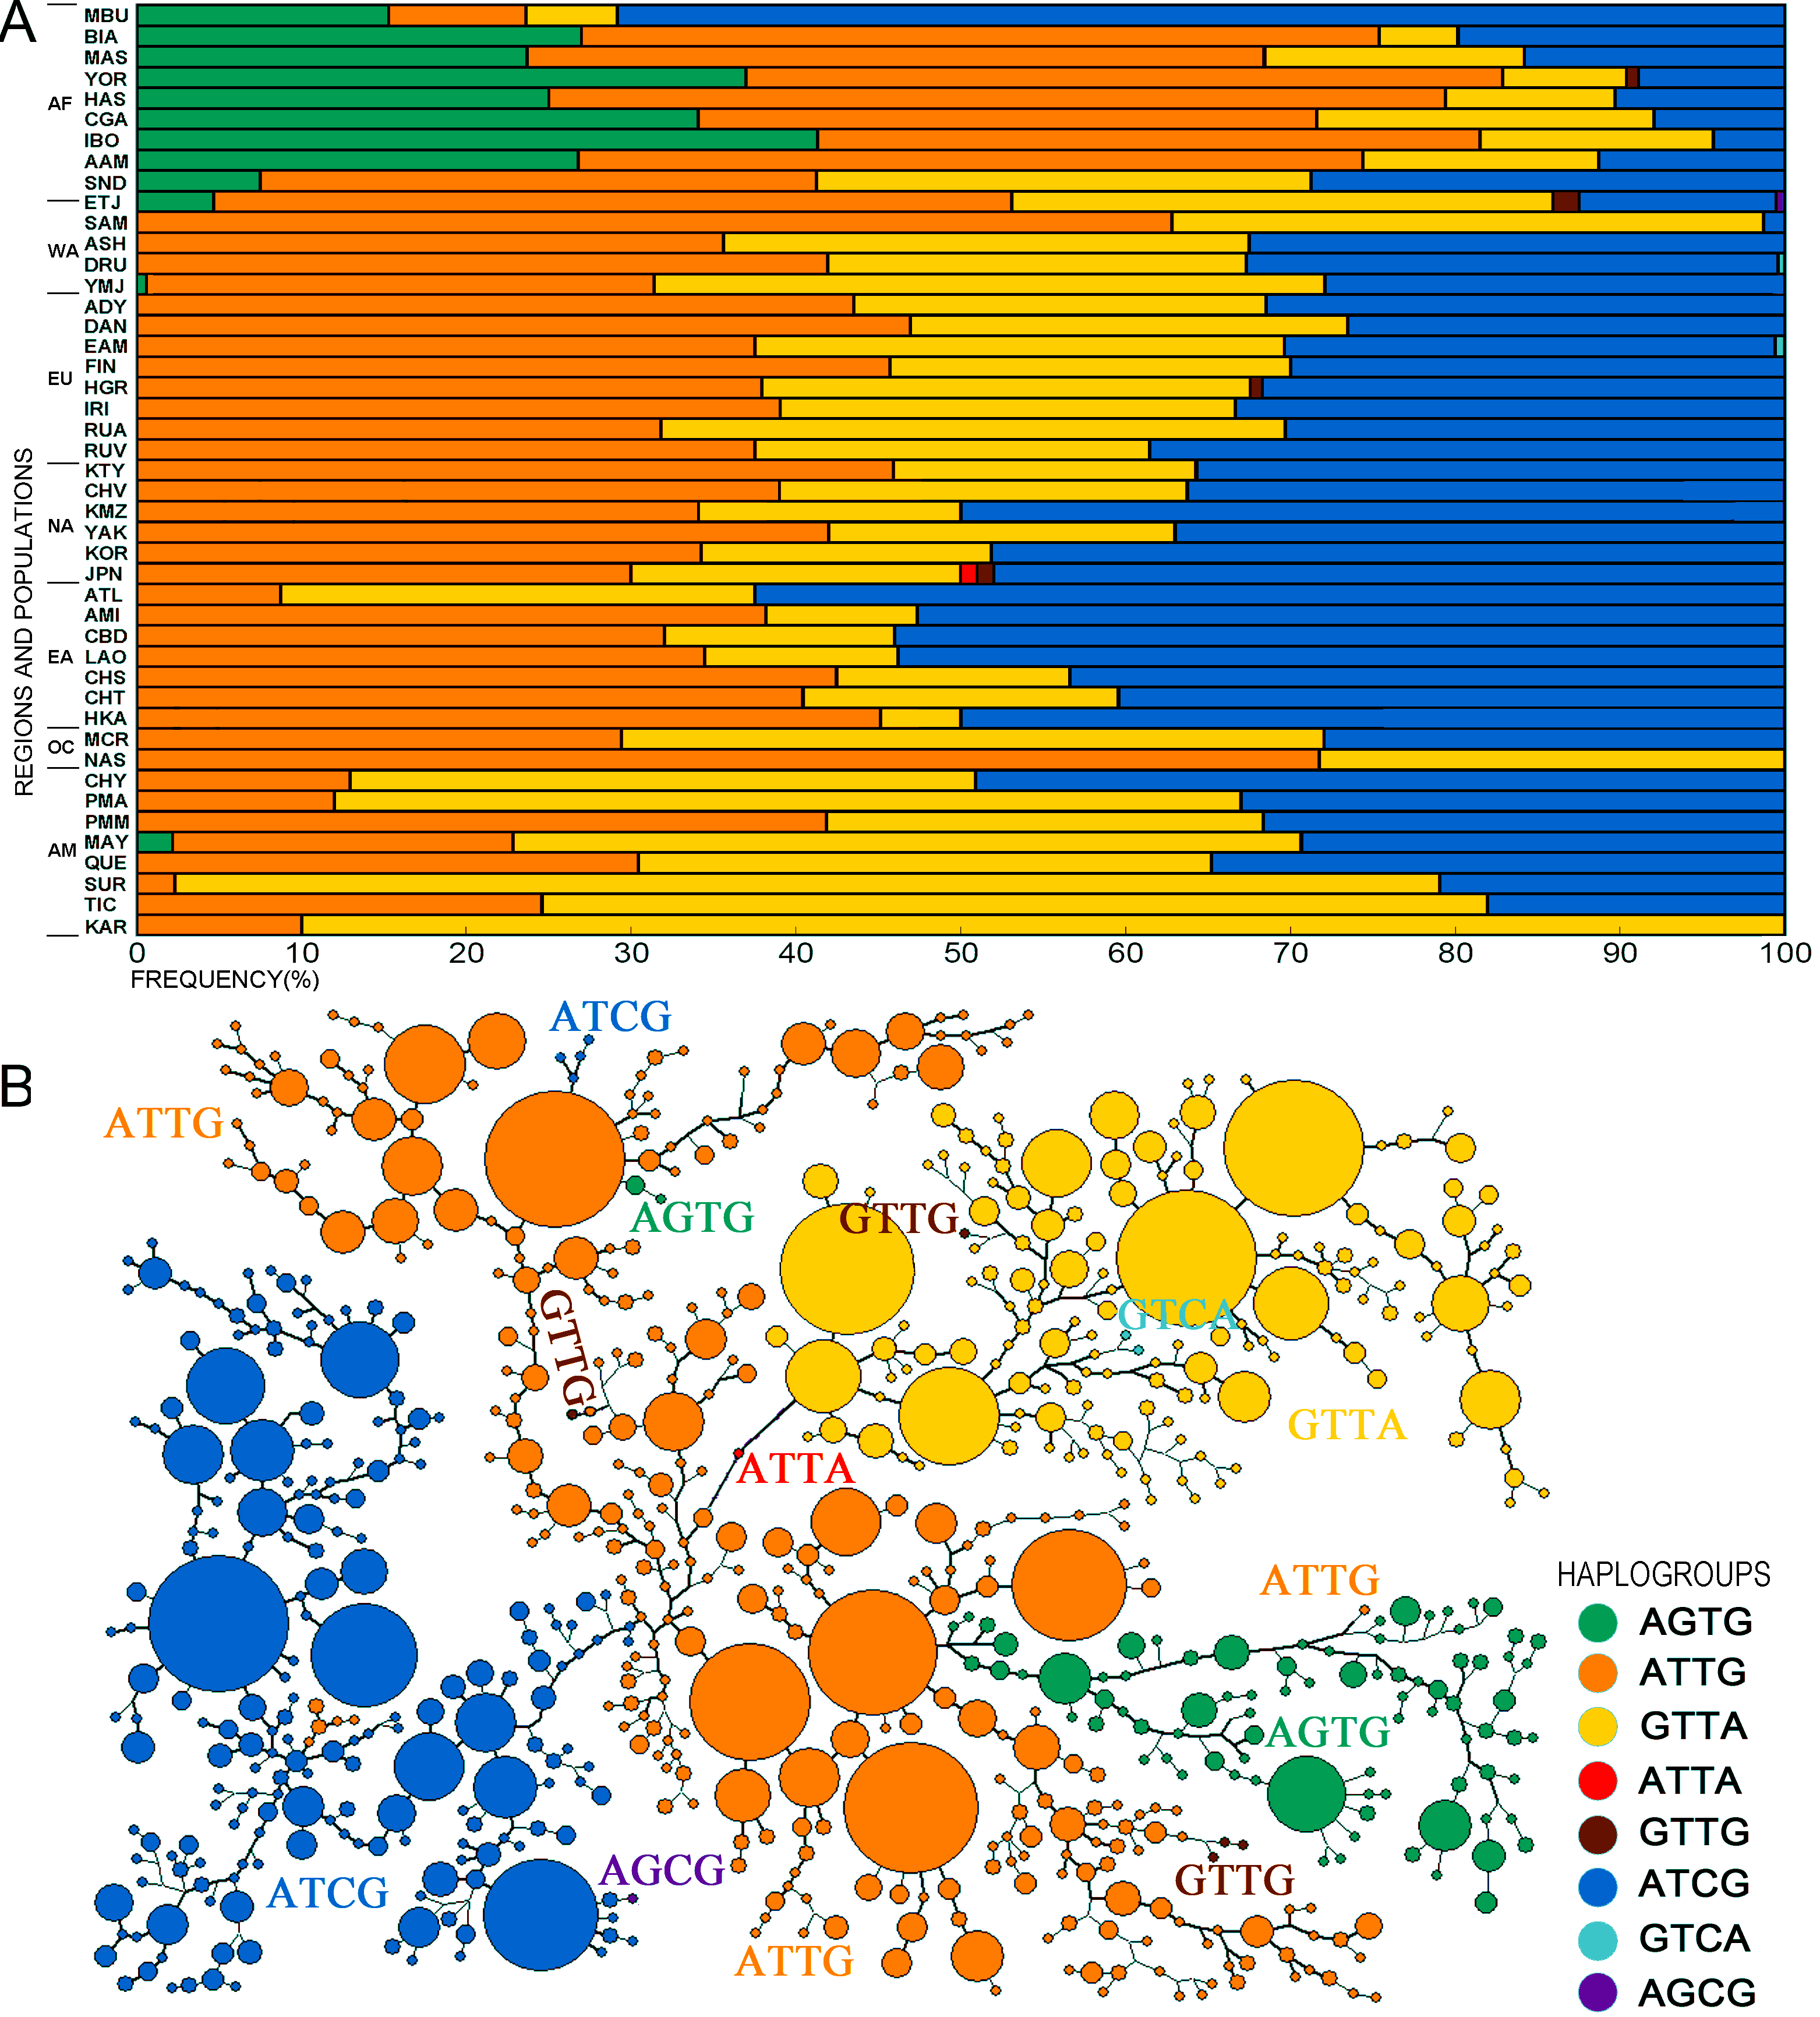
Figure 2. Haplotype diversity of TAS2R16 among the global populations.
The SNPs forming the core haplotypes are rs1357949,
rs846664, rs702424, and rs9691345. (A) Haplotype frequencies of the world
populations. The haplotype frequencies are also in ALFRED
(http://alfred.med.yale.edu/). (B) Shortest tree of the haplotypes defined using
Network with all 55 typed SNPs. The four SNP haplotypes are marked in the tree
and color coded as in part A.
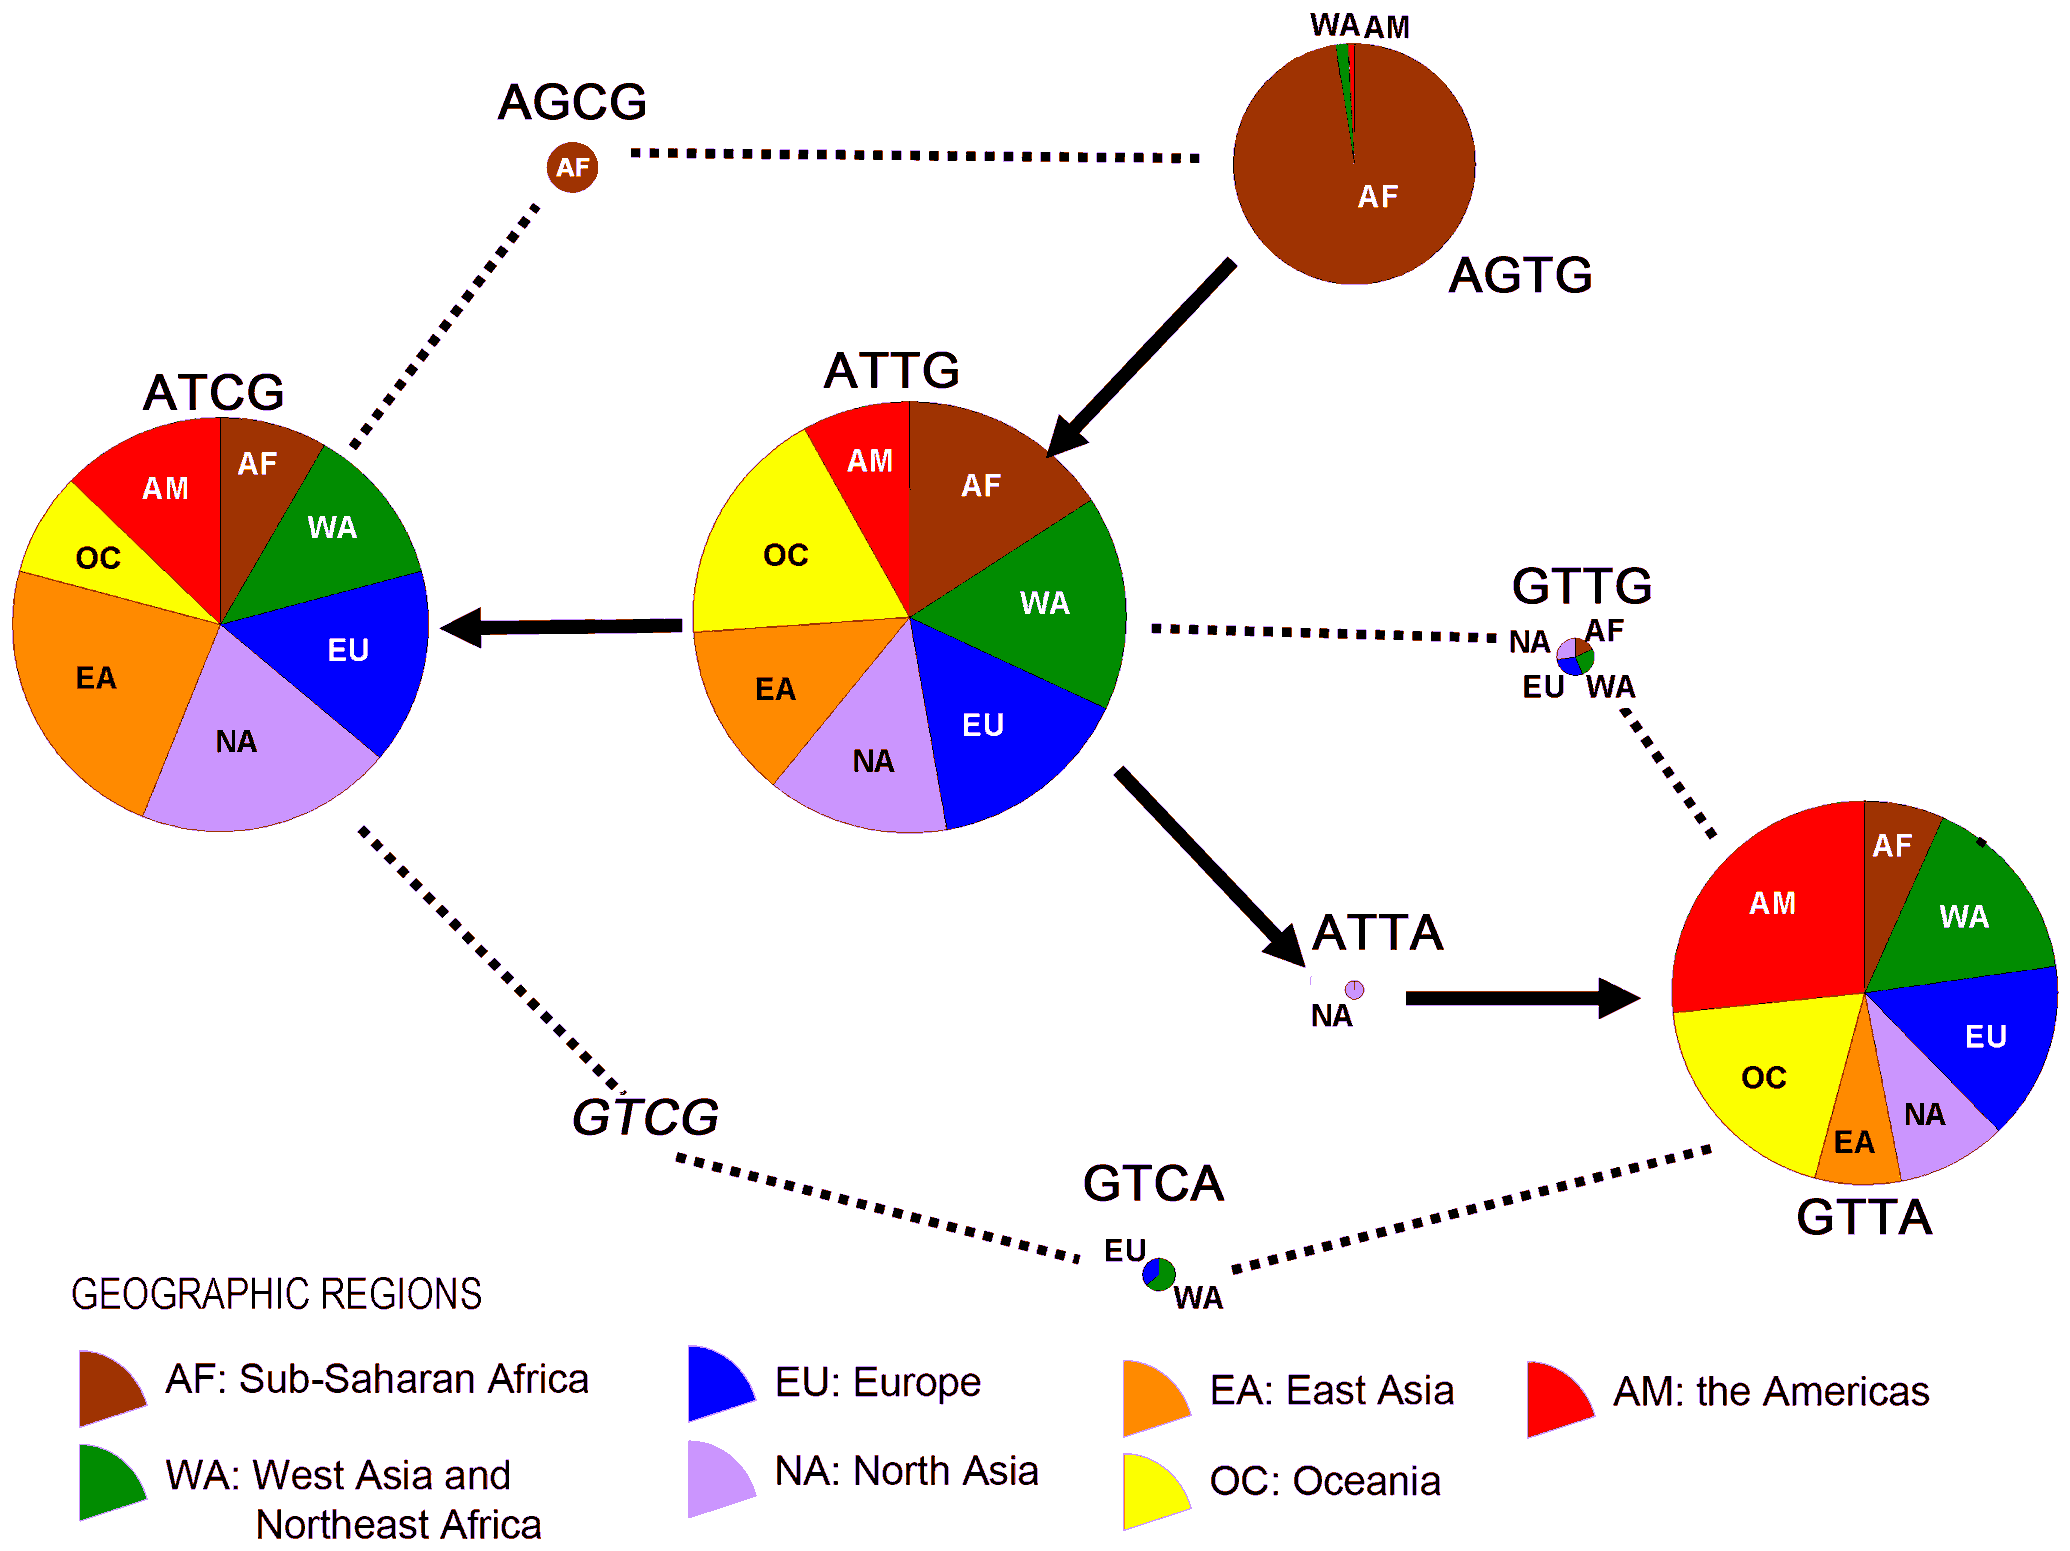
Figure 3. Evolutionary relationships among the core 4-SNP haplotypes in Figure
2.
The solid arrows stand for the likely historical
accumulation of mutations, and the dotted lines indicate possible recombinations.
The four SNPs are those in Figure 2, in the same order.
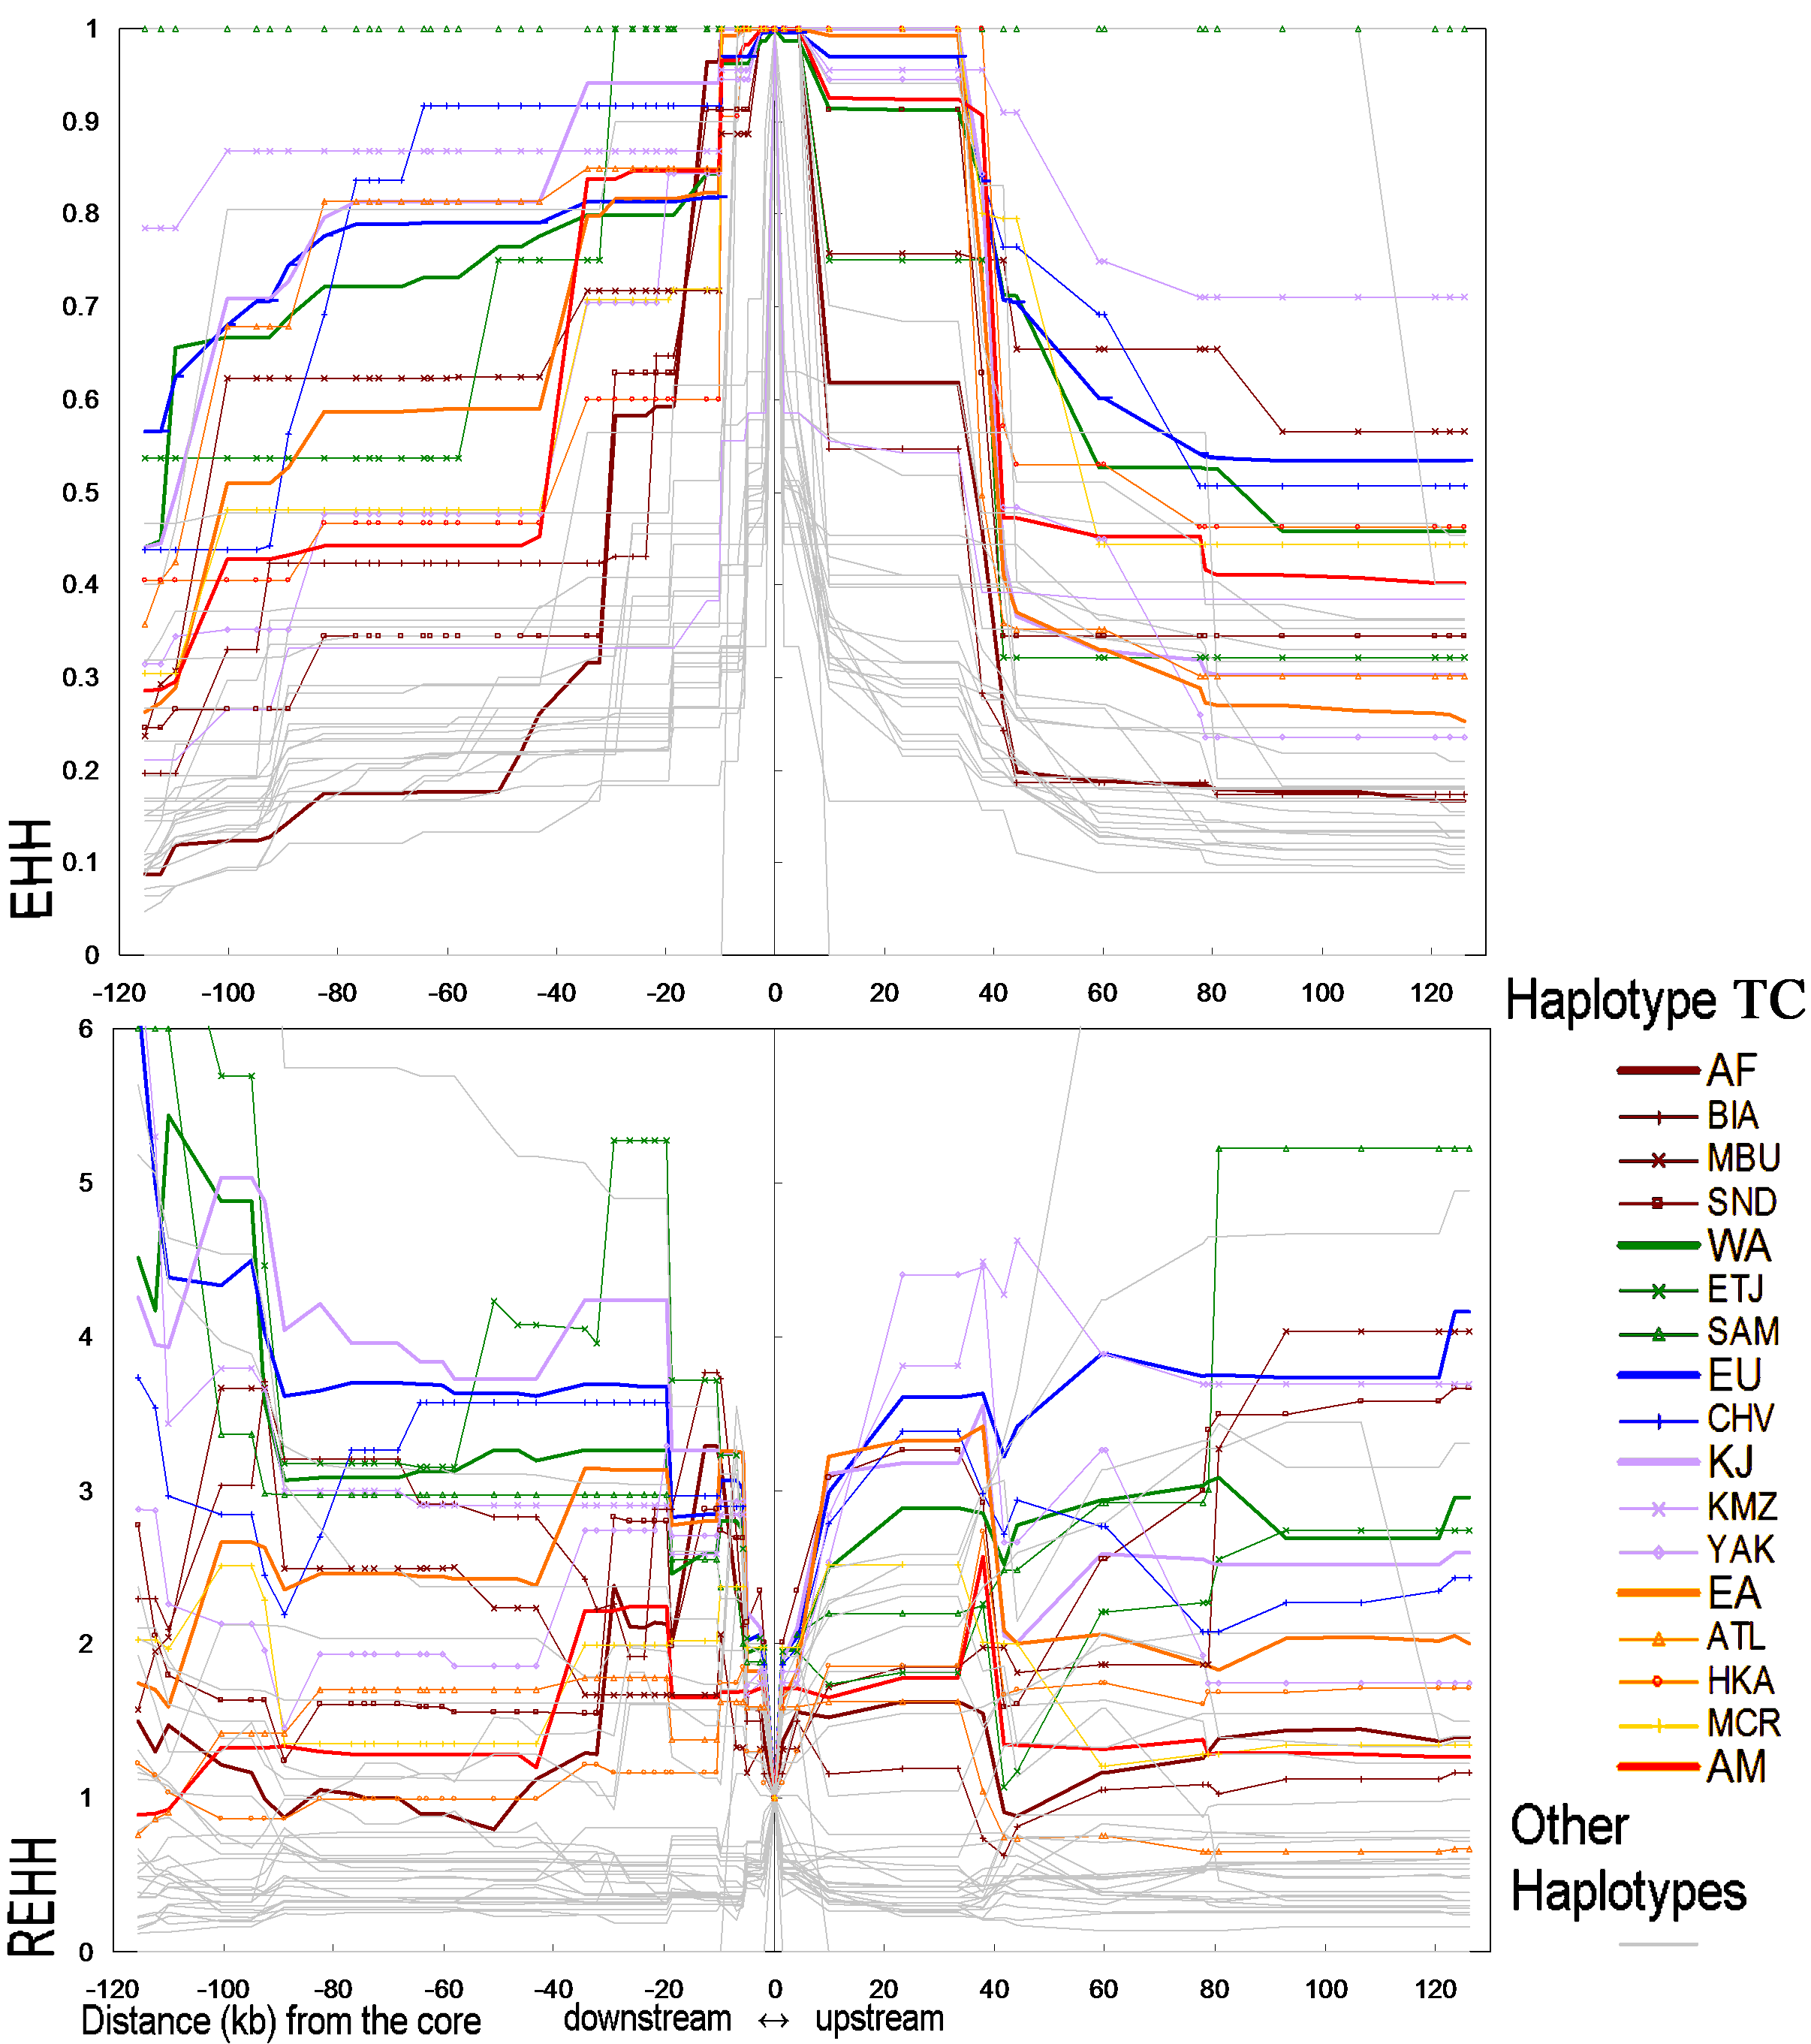
Figure 4. EHH and REHH values for the core haplotypes formed by rs846664 and
rs702424.
We combined the populations with similar core haplotype
frequencies (examined by Fisher’s Exact Test) to make the chart clear. The
region abbreviations are the same as those in Figure 2A.
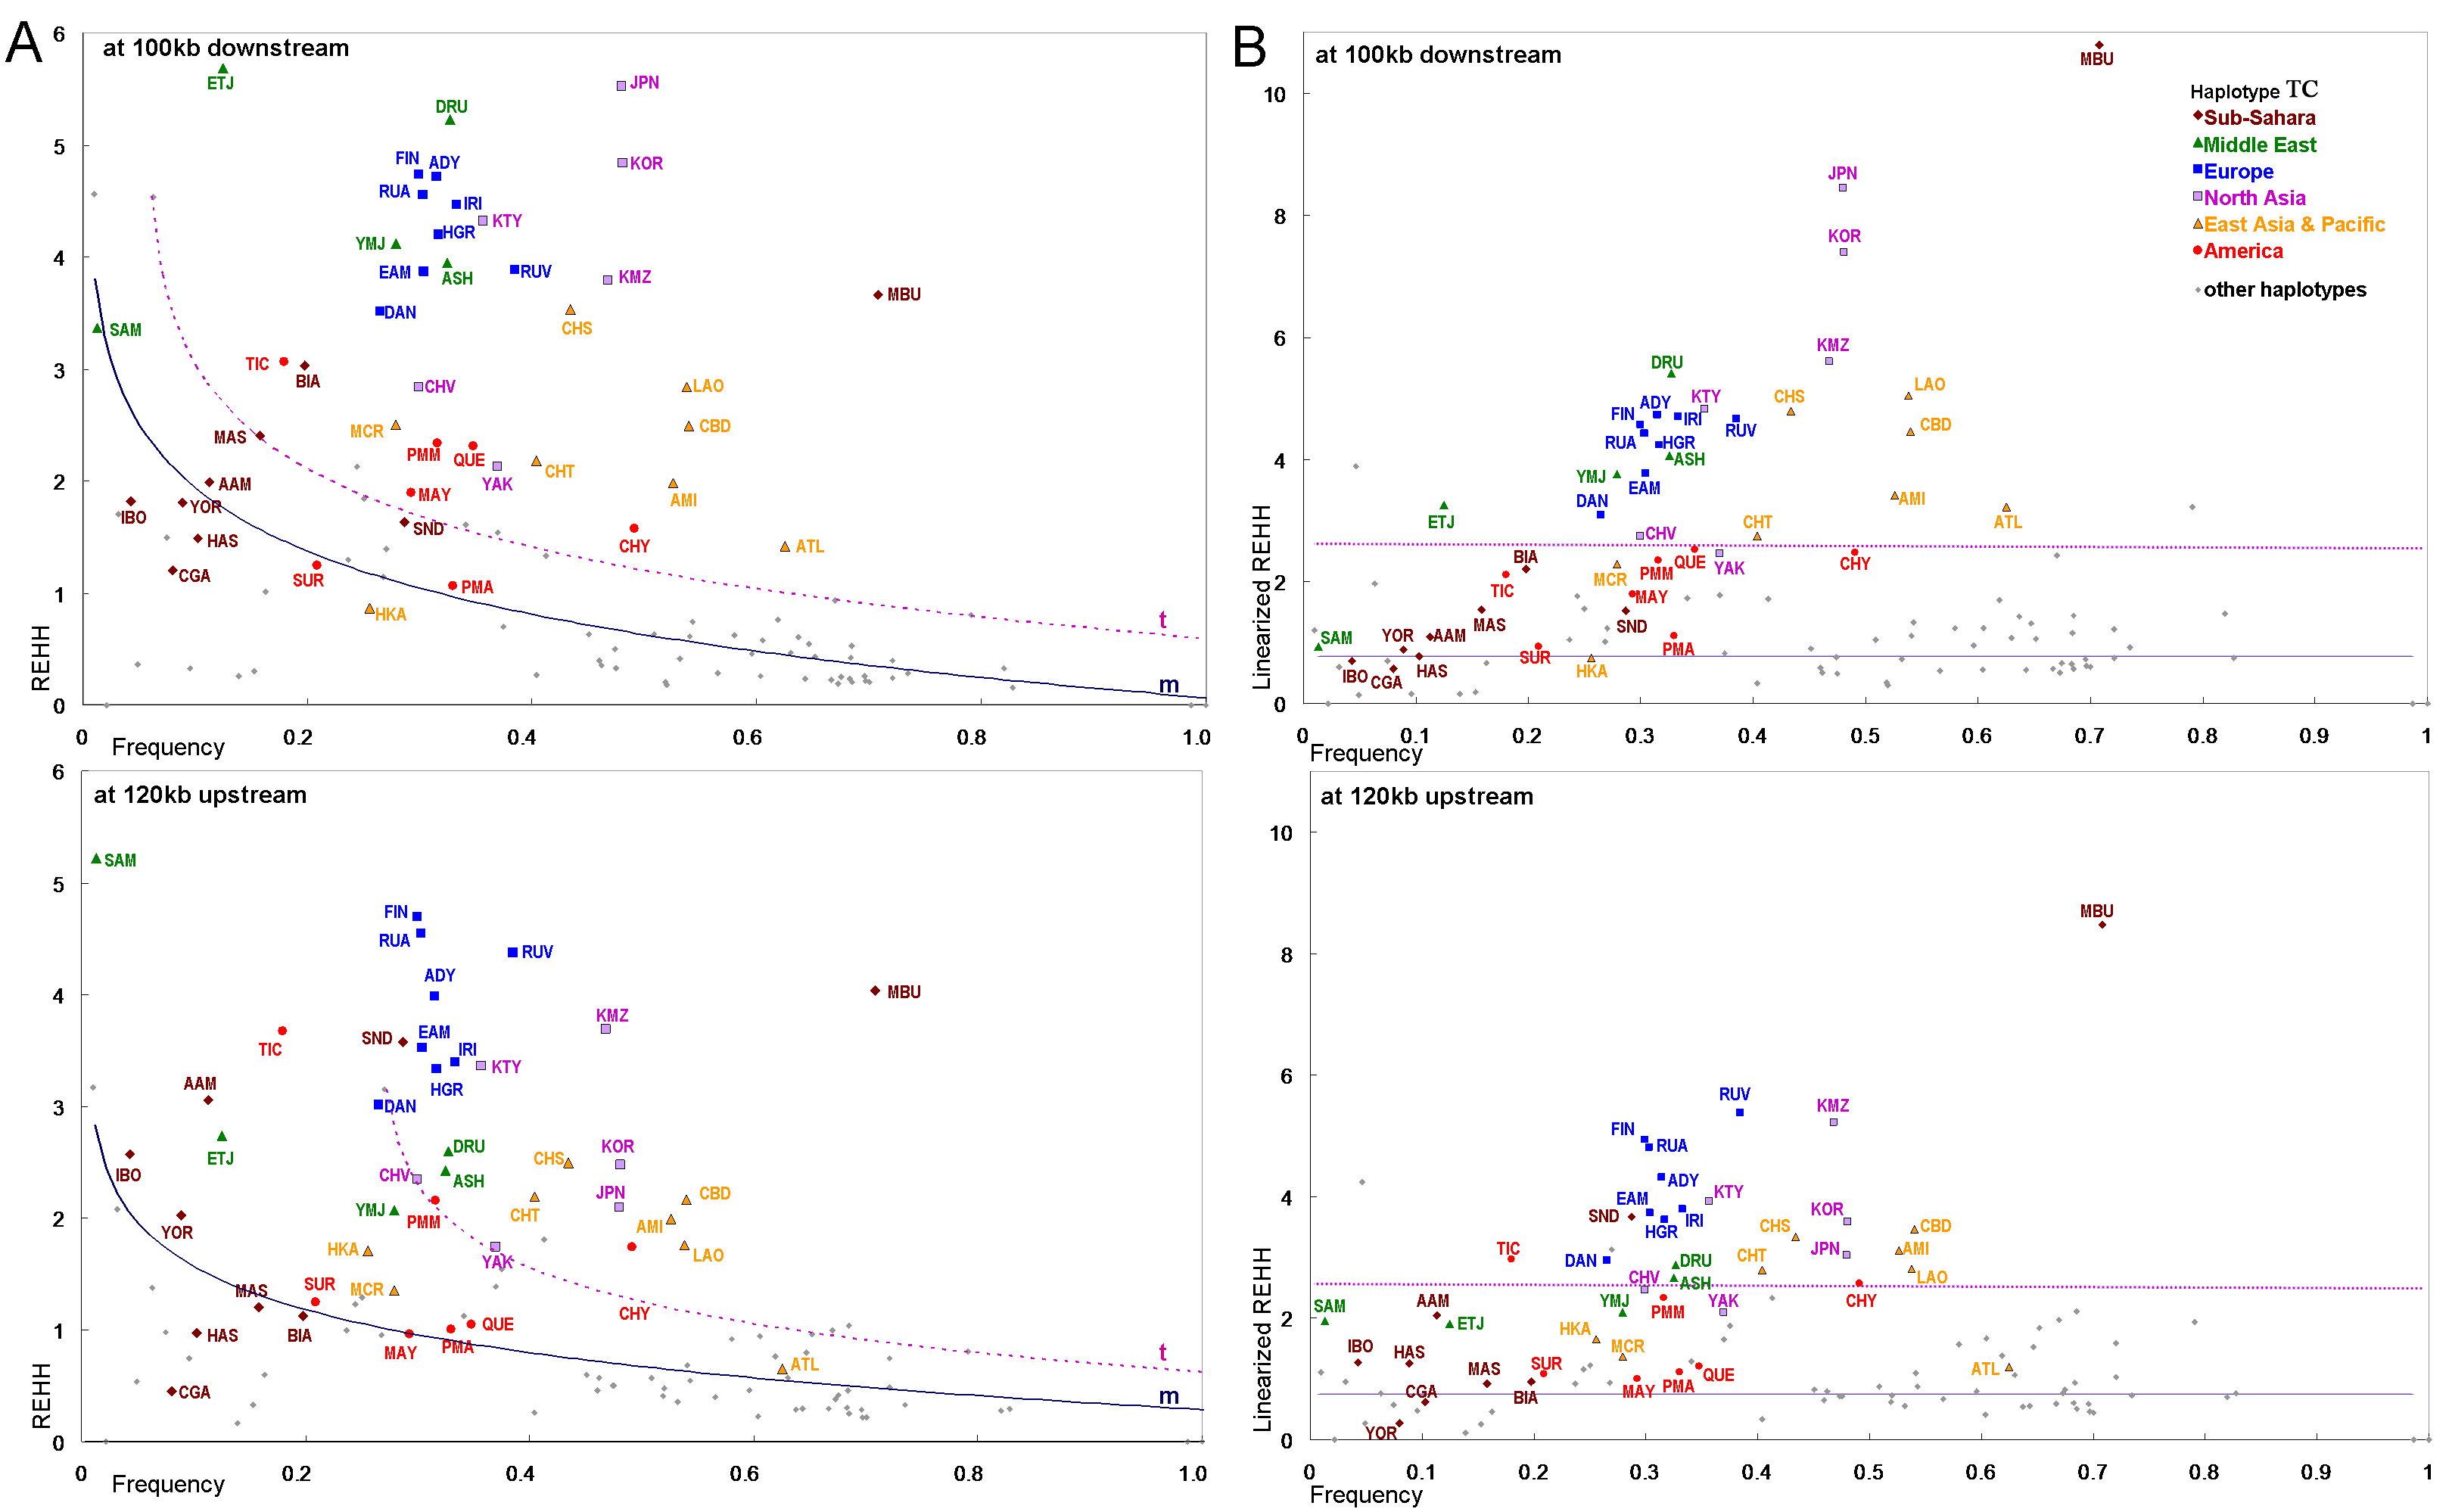
Figure 5. Reference frame of REHH-Haplotype frequency (A) and LREHH-Haplotype
frequency (B).
Curve m was estimated based on all of the REHH values of
the core haplotypes other than TC, and curve t was estimated based on the
highest REHH values of the same haplotypes.
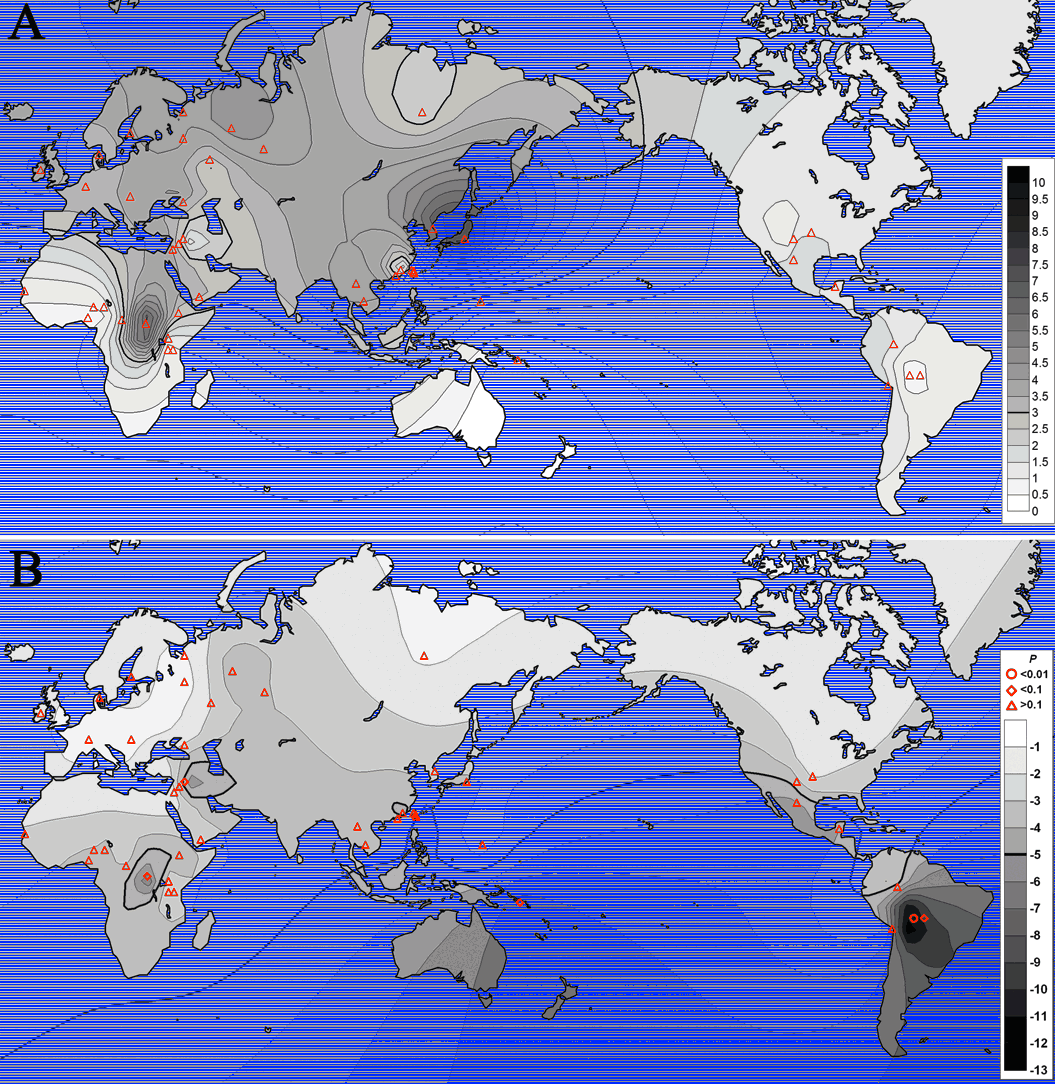
Figure 6. The geographic distribution of LREHH at 100kb downstream from the core
haplotypes (A) and the Fay and Wu’s H statistics (B).
The values for the 45
populations at their geographic locations (red triangles) have been interpolated
by SURFER using default parameters.